
Data-Driven Analytics in XMo
At the XMo Lab, we use data-driven analytics to uncover insights from complex urban datasets, supporting evidence-based decisions and a deeper spatial understanding of cities. Our work began with open-source, publicly available data, ensuring that our analyses are transparent, reproducible, and reusable by other researchers and stakeholders interested in advancing urban mobility research.
DATA SOURCES
The City of Vienna is providing valuable datasets through their open data platform.
OpenStreetMap has been an excellent source of data, as it is continuously enriched by contributions from communities and individuals around the world. In Vienna, the city itself acts as the responsible authority for OpenStreetMap, reviewing and verifying user-contributed data to ensure its accuracy and reliability.
GTFS (General Transit Feed Specification) data provided by the public transport operator contain detailed information about transit schedules, routes, and stops. This dataset enables accurate modeling and analysis of public transport network.
Digital Elevation Model (DEM) data are usually provided by local authorities. DEM data are essential for capturing the topographical characteristics of the study area, which can influence travel behavior and infrastructure design. Many cities now provide similar elevation datasets, enabling researchers to integrate realistic terrain information into their analyses.

EXISTING ALGORITHMS
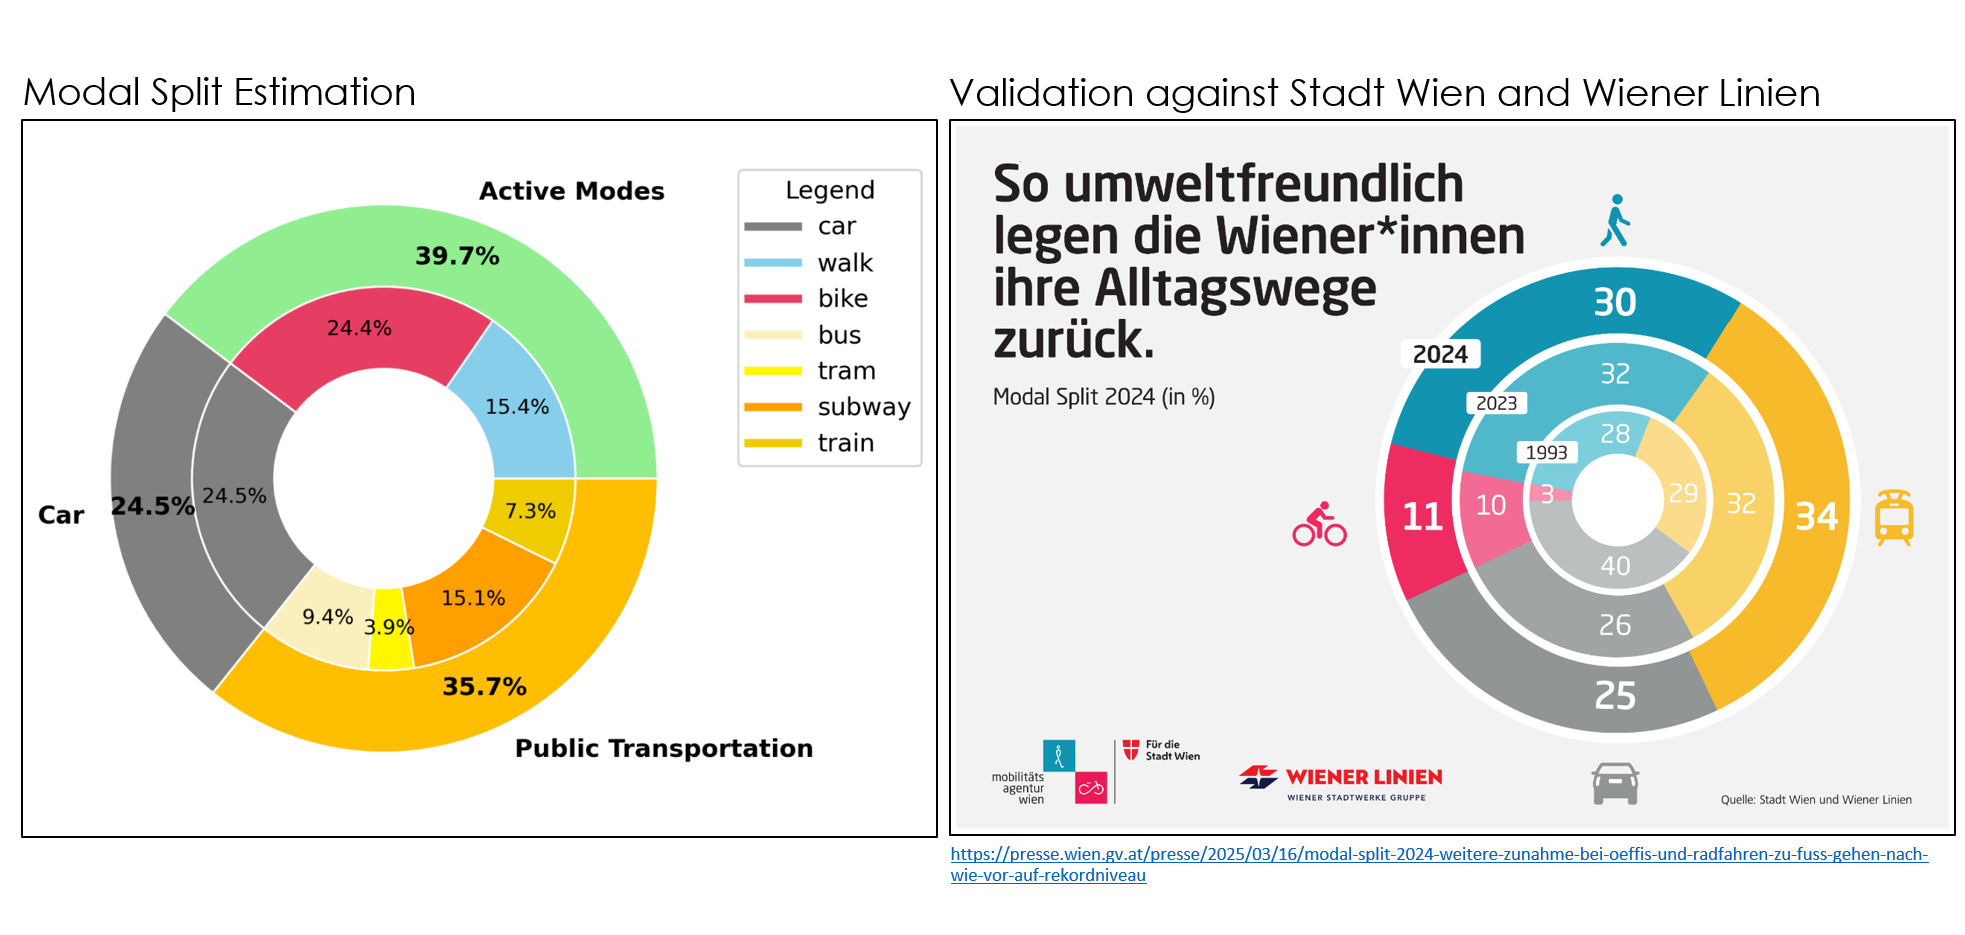
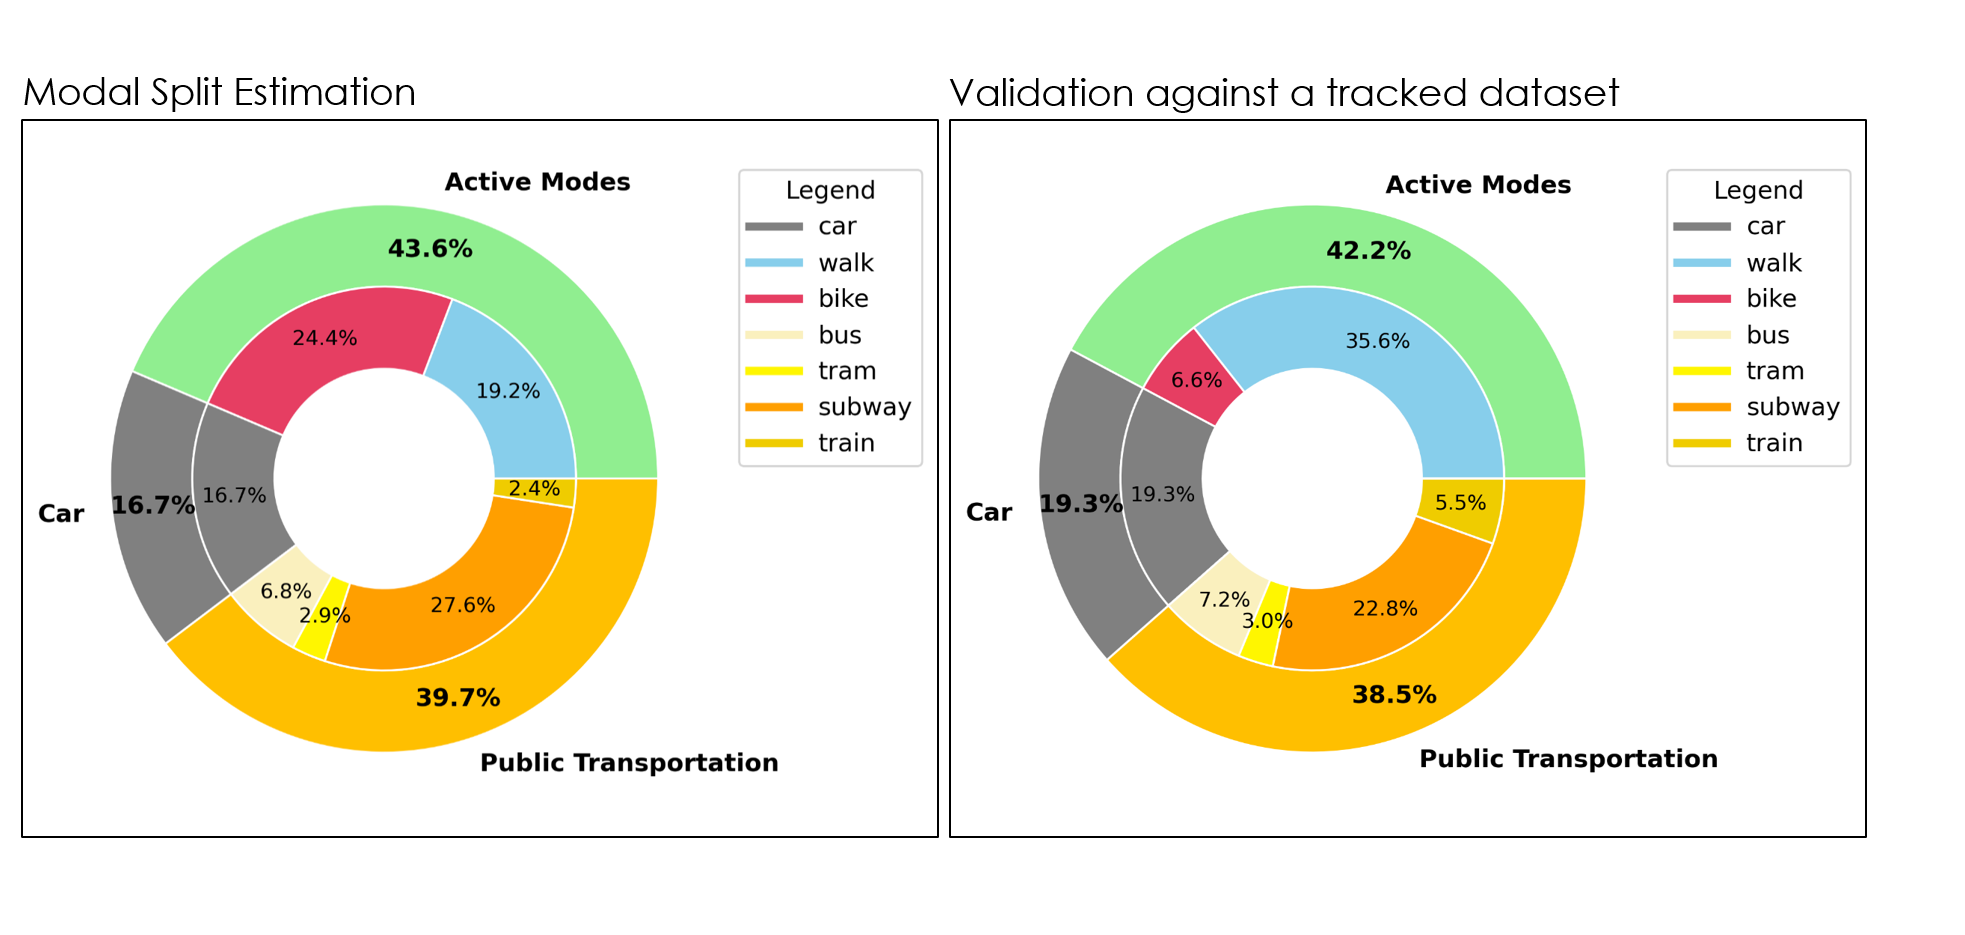
Modal Split Estimation
The Modal Split Estimation predicts by which means of transport people move across a city by combining algorithmic fastest-route calculations with human travel preferences. Using a multimodal transportation network, it estimates the share of trips by car, active modes like walking and cycling, and public transport, even breaking down individual transit types. Validation against official city data shows high accuracy, with deviations under 1.7%, and the approach provides detailed insights that go beyond aggregated statistics.

Route Ranking Tool
The Route Ranking Tool evaluates and ranks sets of routes based on customizable parameters. By highlighting the best and worst routes, it enables the analyses of patterns, surrounding areas, and other factors that can inform further studies or decision-making. The tool is fully flexible, allowing different parameters to be applied depending on the research focus or planning goals.
Detection of Region of Interest
The Detection of Region of Interest algorithm identifies areas that perform worse than others and may benefit from targeted improvements. It analyzes individual segments – considering factors like walkability and bikeability through metrics such as gradient, infrastructure, or green space – as well as aggregated areas, highlighting patterns like station density or access to key services. Metrics can be combined into customizable indices with flexible weighting, to pinpoint regions most in need of intervention or further study.


Segmentation of Space
The Segmentation of Space module divides any geographic area into flexible spatial units tailored to the research question. It can generate hexagons or regular grids of varying sizes, as well as divide the area into irregular polygons, allowing analyses at different spatial resolutions. This adaptability enables consistent comparisons across studies and supports customized investigations of urban patterns and mobility dynamics.